With various governments targeting ‘Net Zero by 2050’ and companies making rapid progress in alternative energy technologies, we are on the cusp of a revolution. We expect to see a massive shift in the way we live and work. Forecasts suggest around a 20-fold growth in revenues for electric vehicles and renewable energy by 2050. This will be accompanied by enormous improvements in range, charging speed, availability and cost. Meanwhile, businesses are developing new technologies that will remove carbon from the air. This is potentially a fantastic long-term growth story.
There are many investment solutions that seek to capitalise on the climate opportunity. Among them, we believe a multi-asset approach is particularly compelling. Here, asset managers can offer investors a focused exposure to the climate theme, while seeking to carefully manage the risks that sometimes come with higher return potential.
Achieving strong thematic exposure can be harder than you think
The first challenge for investors is how to access the climate theme. It can be surprisingly hard to find investment funds with strong exposure to the technologies that will drive the low-carbon transition. These technologies include renewable energy generation and equipment, electric vehicles, battery technologies, energy efficiency and renewable heat.
This is counterintuitive, given the dozens of sustainability funds that investment houses launched in the last few years. But if you take a look at the top-10 holdings in many funds with ‘climate’ or ‘sustainable’ in the label, you will frequently find mainstream names like Microsoft or Amazon. These companies may have good operational environmental policies, but they are not strongly exposed to the climate opportunities theme. Their earnings come from software services and online retail, not renewable energy or battery technologies. Why, then, are they in the portfolio? We suspect it is because most sustainability or climate funds have standard equity benchmarks and tight tracking-error limits that require them to hold benchmark-like exposures.
This is one reason why European regulators are concerned that funds labelled ‘sustainable’ and ‘climate’ might be confusing to customers. Enter the European Union’s new Sustainable Finance Disclosure Regulation. It requires funds with sustainability investment objectives to report their exposure to objectively defined sustainable business activities (the EU Taxonomy). This transparency should make life easier for customers looking to invest in a sustainable way.
Our initial analysis suggests that standard global equity benchmarks only have a 5-10% exposure to EU Taxonomy-aligned activities. We find that many funds that are labelled ‘sustainable’ do better than this, doubling the level of exposure to 20%. However, this still leaves 80% of funds exposed to activities that are not strongly associated with the sustainability theme.
One solution is to forgo standard equity benchmarks and instead start with a list of companies whose core businesses provide climate solutions. This means investors can potentially align around 75% of their portfolio with the EU Taxonomy, rather than a mere 20%. This means, though, that such a fund will perform differently to standard equity benchmarks. However, we believe that if an investor is serious about gaining strong exposure to the climate theme, then the portfolio has to look different to a benchmark that is only 5% exposed to this theme.
Managing risk associated with concentrated thematic exposures
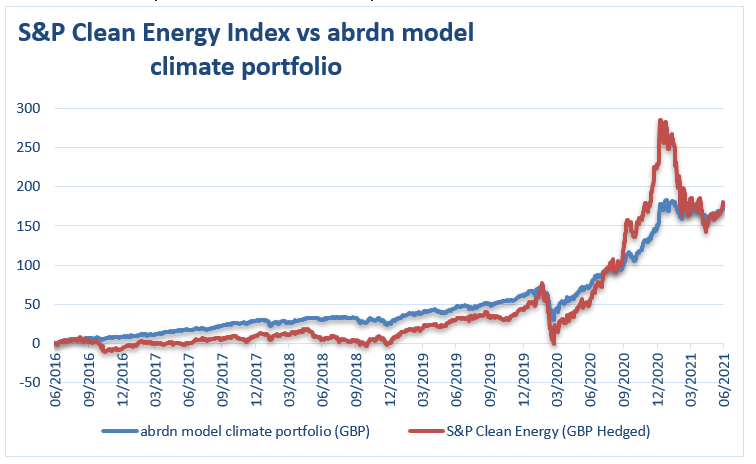
While strong thematic exposure might be an investor’s goal, there can be dangers in taking a highly concentrated exposure to sustainability themes. The S&P Clean Energy Index provides a good example. It sold-off during the pandemic shock in March 2020, then rose sharply, before falling again by 50% from its peak in January to May this year (see chart). Overall, it has offered investors decent returns – but put them through quite a roller coaster ride. By our calculations, the volatility of exchange-traded funds (ETFs) based on this index has been around double that of standard equities over the last three years. There is a similar story for other thematic ETFs.

Source: abrdn, Bloomberg, MSCI, S&P. August 2021.* Past performance is not a guide to future returns and future returns are not guaranteed.
How can we achieve a smoother investment journey? We believe diversification provides the answer. And one way is through a multi-asset approach that seeks to ensure diversification at two levels: through equities and across asset classes. Within equities, investors can have broad exposure across the full range of companies exposed to the climate theme. Investors can also diversify across asset classes. For example, by holding pure climate exposures in ‘green bonds’, renewable energy infrastructure and ‘green equities’.
To illustrate this, we created a model multi-asset climate portfolio. As the chart shows, the strategy was able retain a very high exposure to the climate solutions theme – but with less than half the volatility of the S&P Clean Energy Index
Final thoughts…
As technologies develop, we have the chance to make sure our children inherit a more sustainable world. The route to this change will come in part through the investments and the choices we make. One way is by investing in companies that are engaged in activities that seek to help the world mitigate, or adapt to, climate change. In doing so, investors can play their part to try and ensure that climate change is not inevitable. But the clock is ticking. As an eminent economist wrote: “things take longer to happen than you thought they would and then happen faster than you thought they could.”* These figures relate to simulated past performance. The simulation was performed using a model portfolio of equity, credit and infrastructure securities with high EU Taxonomy alignment. When interpreting the results, the investor should always take into consideration the limitation of the model applied. The returns are shown before fees and other charges. The impact of any charges will reduce the performance shown. Figures are shown in GBP. Source: adrdn, Bloomberg, MSCI, S&P. August 2021.